
Expected Value in Basketball Betting: How to Calculate and Find +EV Bets
 Available in US
For the first two years of my basketball betting life, I thought a “good bet” was one that won. A winning night meant I was skilled; a losing night meant I was unlucky. Then I learned about expected value, and it completely rewired how I evaluate my decisions. EV doesn’t care about the result of a single bet. It measures whether the bet itself — the price you accepted, the probability you assigned — was a sound decision at the moment you made it. That shift from outcome-based to process-based thinking is, without exaggeration, the dividing line between recreational punters and serious analysts.
The global basketball betting market stands at $8.7 billion and is projected to grow to $18.4 billion by 2033. Every pound wagered into that market either has positive expected value (you’re getting a better price than the true probability warrants), negative expected value (you’re not), or sits precisely at break-even. The bookmaker’s margin ensures that most available prices are slightly -EV. Your job, if you want to be profitable, is to find the exceptions.
The Expected Value Formula for Basketball Bets
I remember the exact moment EV clicked for me. I was sitting with a spreadsheet open, calculating the expected return on a Bucks moneyline bet at 2.10 where my model gave Milwaukee a 52% chance of winning. The formula showed a clear positive expected value, and I realised that the bet was good regardless of whether the Bucks actually won that night. The logic was liberating.
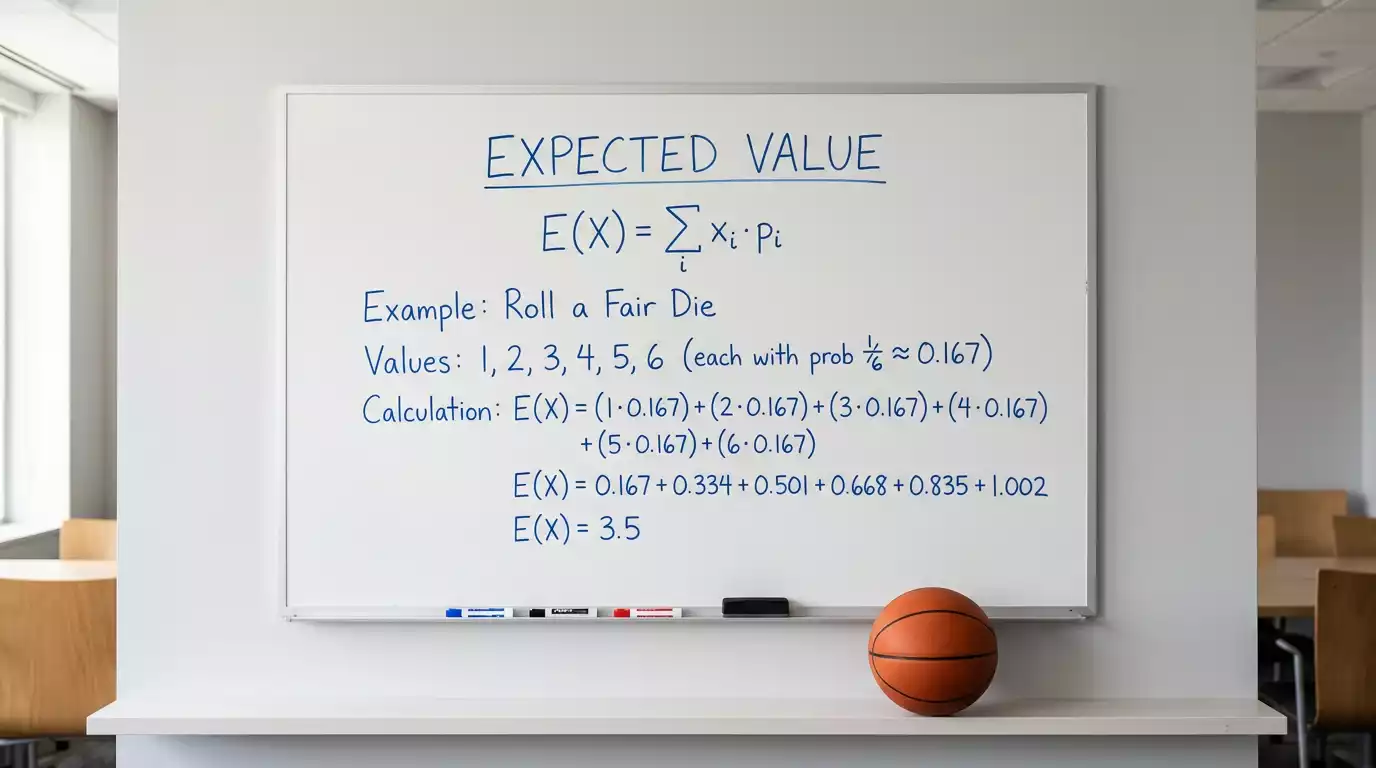
The formula is: EV = (Probability of Winning x Profit if Win) – (Probability of Losing x Stake Lost). You can express the result as a pound amount per pound staked, or as a percentage of your stake.
A worked example: you believe the Celtics have a 58% probability of covering -4.5 against the Bulls. The bookmaker offers 1.91 on that side. Your potential profit on a GBP 100 bet is GBP 91 (since 100 x 1.91 = 191, minus your 100 stake). Your probability of losing is 42%. EV = (0.58 x 91) – (0.42 x 100) = 52.78 – 42.00 = +10.78. That’s +GBP 10.78 per GBP 100 wagered, or roughly +10.8% EV. Anything above zero is a profitable bet in expectation.
The critical variable is your probability estimate. The formula is mechanically simple — the difficulty is in the input. If your 58% estimate is accurate, the bet is strongly +EV. If your estimate is off by five percentage points and the true probability is 53%, the EV drops to about +1.2% — still positive, but barely above the noise floor. If the true probability is 50%, the bet is -EV despite feeling confident. Everything in EV analysis hinges on the quality of your probability assessment.
This is why I always stress that EV isn’t a magic wand. It’s a framework that makes your analysis explicit and testable. Rather than asking “do I think the Celtics will cover?”, you’re asking “what probability do I assign to the Celtics covering, and is the bookmaker offering me a better price than that probability warrants?” The second question is harder, but it’s the only one that matters for long-term profitability.
How to Identify Positive EV Opportunities
Finding +EV bets on NBA games is not about being smarter than the bookmaker’s model. It’s about finding spots where the model’s output — the odds on your screen — doesn’t fully reflect the current situation. Those gaps exist, but they’re narrow and fleeting.
The most consistent source of +EV in basketball is the opening line. When bookmakers first post odds for an NBA game, the line is based on their model’s overnight run, which may not fully incorporate late developments — coaching strategy shifts, player rest decisions that haven’t been announced, or contextual factors like altitude effects for Denver home games. Sharp bettors who process this information faster than the market can capture +EV by betting early before the line adjusts.
Injury news creates another window. When a significant player is ruled out 90 minutes before tip-off, the line adjusts — but the initial adjustment sometimes overshoots or undershoots the player’s actual impact. If you have a model or framework for estimating a player’s point spread impact (based on their on-off splits, usage rate, and defensive contribution), you can assess whether the line has moved too far or not far enough.
FanDuel and DraftKings together control roughly 75% of the US sports betting market by handle. Their closing lines on NBA games are among the sharpest in the world, meaning they approximate the “true” probability as closely as any publicly available price. Comparing your sportsbook’s odds against these closing lines gives you an empirical measure of whether you’re likely finding +EV — if you’re consistently getting better prices than where these operators close, your process is working.
For the relationship between early betting, closing lines, and measuring your edge over time, the closing line value guide provides a complementary framework for assessing whether your +EV identification process translates into real results.
Why Positive EV Does Not Guarantee Short-Term Profits
I once went through a stretch of 40 bets where my average EV was +3.2% per bet — well above break-even — and I still lost money. Not a trivial amount, either. The variance of NBA outcomes, where 52% win probability means you’re losing 48% of the time, can produce brutal short-term results even when every decision was correct.
This is the hardest lesson in EV-based betting: the gap between process quality and outcome quality can persist for hundreds of bets. A coin with 52% heads probability can easily come up tails eight times in a row. An NBA spread bet with 54% true probability can lose twelve of twenty attempts without any statistical alarm bells ringing. You need a sample of 500 to 1,000 bets before the signal reliably separates from the noise.
The psychological challenge is enormous. Losing money while doing everything right requires a level of process trust that most people — including experienced bettors — find difficult to maintain. The temptation to abandon a +EV approach after a losing month and revert to gut-feel or narrative-driven betting is powerful precisely because the short-term results of both approaches are indistinguishable. Only at scale does +EV assert itself.
This is why bankroll management and EV analysis are inseparable. A +EV betting approach with reckless staking will blow up before the edge has time to compound. A well-managed bankroll with -EV bets will slowly bleed out. You need both: the right bets at the right sizes, sustained across enough volume for the maths to work. It’s not glamorous. It’s not quick. But after nine years of covering these markets, it’s the only approach I’ve seen produce consistent, replicable results.
How do you estimate the true probability needed for EV calculations?
There are several approaches. Building a statistical model using team efficiency ratings, pace data, and contextual factors is the most rigorous method. Alternatively, you can use the closing line at a sharp sportsbook as a proxy for true probability — if the market closes at 1.85, the implied probability (after removing the margin) is roughly 52-53%. Comparing your assessment against this benchmark tells you whether you’re identifying genuine edges or just making optimistic estimates.
Can recreational bettors realistically find positive EV basketball bets?
Yes, though the opportunities are fewer and narrower than for full-time professionals. Recreational bettors can find +EV by shopping for the best available odds across multiple sportsbooks, betting early when lines are less efficient, and specialising in specific teams or market types where they develop genuine expertise. The key constraint is time — identifying +EV requires research, and the edge per bet is typically small enough that high volume is needed to produce meaningful returns.
What tools help calculate expected value for NBA betting?
Several free and subscription-based tools exist. Odds comparison websites show real-time prices across multiple sportsbooks, making it easy to identify the best available line. Some platforms offer built-in EV calculators where you input your probability estimate and the odds offered. For more advanced users, building a simple spreadsheet that calculates EV from your model’s output and the sportsbook’s decimal odds takes minutes and serves as a permanent tool.
Created by the ”Basketball Betting Terms” editorial team.